Home > GC > Chapter 1 > Lesson 1.1.2 > Problem 1-16
1-16.
Match each table of data below with the most appropriate graph and briefly explain why it matches the data.
Time will always be shown on the
Boiling water cooling down
Time (min.)
Temp. (
C) Determine if the
are increasing or decreasing. Since the numbers for the
are decreasing, the only graph which fits is Graph . Cost of a phone call
Time (min.)
Cost (cent.)
Are the
increasing at a constant rate? This could be Graph
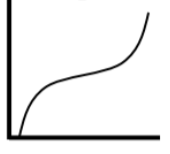
or Graph , but the table would not contain the point , so it must be Graph . Growth of a baby in the womb
Age (months)
Length (inches)
Identify the pattern of how the length increases.
Graph
fits best.
Graph 1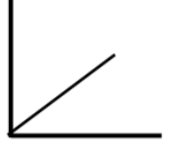
Graph 2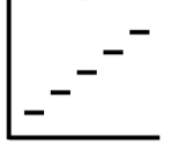
Graph 3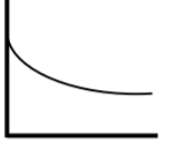
Graph 4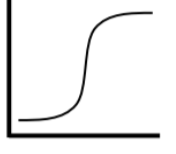
Graph 5