Home > MC1 > Chapter 1 > Lesson 1.3.1 > Problem 1-103
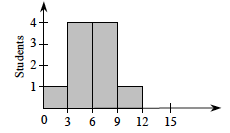
Given the data in the table below, copy and complete the histogram at right to represent families of various sizes. Remember that data that falls on a tick mark (that is,
Student | # of family members |
|---|---|
LaTrese | |
James | |
Phu | |
Byron | |
Evan | |
Diamond | |
Jackie | |
Antonio | |
Shinna | |
Ryan |
Look at problem 1-100 in your book to get you started on this histogram. Make sure to try creating your own graph before checking the answer.
Begin by counting how many students have families with less than
Families with less than
Families with
Families with
Families with
In what range do the most number of family members fall? Remember to answer all of the questions.