

Home > MC2 > Chapter 4 > Lesson 4.3.2 > Problem 4-87
Mt. Rose Middle School collected canned food to donate to a local charity. Each classroom kept track of how many cans it collected. The number of cans in each room were:
What is the range of the data? Are there any outliers?
The range is the length of the interval from the lowest to the highest data point. An outlier is data that is much higher or lower than the others. In other words, it does not fit in with the others.
Range:
Outliers:and could be outliers The main office staff collected
cans, the counseling staff collected cans, and the custodial staff collected cans.
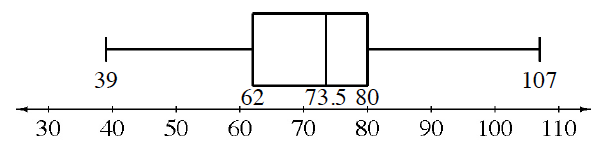
On graph paper, make a new box plot that includes this data. Clearly label the median and the upper and lower quartiles.If the data points
, , and are added, how does the entire data set change as a result? Lower Quartile:
Upper Quartile:Remember, the median is the middle value that divides the upper and lower halves. The lower quartile is the middle value of the lower half of the data, while the upper quartile is the middle value of the upper half of the data.
Use the eTool below to create the new plot.
Click the link at right for the full version of the eTool: 4-87 HW eTool ![]()