

Home > MC2 > Chapter 6 > Lesson 6.1.5 > Problem 6-49
6-49.
For each scatterplot below:
Determine if there is a "trend" or correlation in the points. If there is, describe it.
Label each graph as showing a positive correlation, negative correlation, or no correlation.
Refer to the Math Notes box from Lesson 6.1.4 for help.
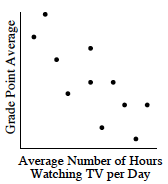
As the number of hours watching TV increases, the Grade Point Average decreases.
The graph has a negative correlation.
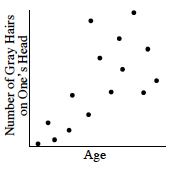
Positive correlation.
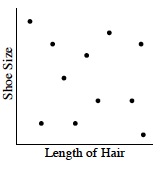
Is there any trend in the graph above?