Home > MC2 > Chapter 6 > Lesson 6.1.6 > Problem 6-61
6-61.
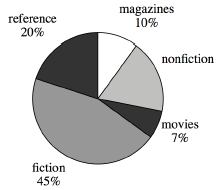
The school library has
According to the graph, what percentage of the collection are nonfiction books?
Could the librarian have presented this information in a histogram? Why or why not?
Recall the qualities of a histogram.
How does it display information?A histogram displays data as a numerical order.
Since this data is not numerical the librarian cannot present this information in a histogram.How many of the books in the library are fiction?