Home > CC1MN > Chapter 1 > Lesson 1.1.4 > Problem 1-32
1-32.
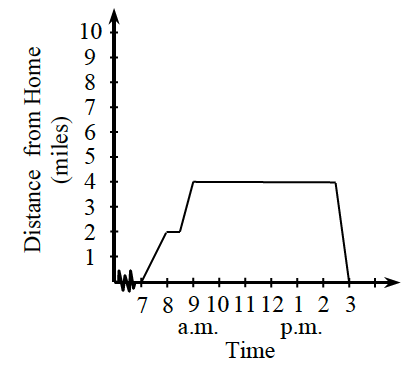
The graph at right shows how far Ben is from home during a typical school day. Use the graph to answer the questions. Write your answers in complete sentences.
What was Ben doing between 7:00 a.m. and 8:00 a.m.?
Why was Ben traveling farther away from home during this time? Consider what he might be doing during the day.
Possible reason: Ben was biking to school.
What do you think Ben was doing between 9 a.m. and 2:30 p.m.?
Why would Ben be staying still for a long time?
What time did Ben leave to return to his starting point?
Examine the graph to see when Ben moves closer to home. Now try to estimate when Ben returned home before looking at the answer.
About 2:30 p.m.