Home > CC1MN > Chapter 9 > Lesson 9.1.3 > Problem 9-31
9-31.
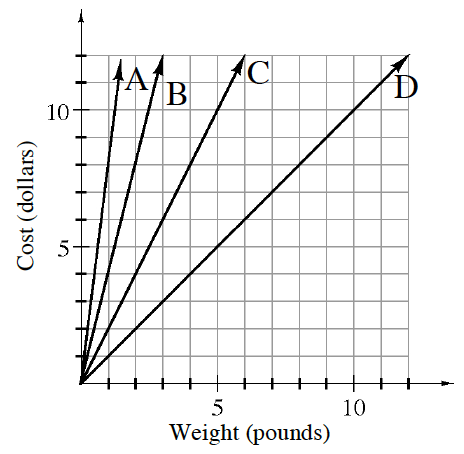
The graph at right shows the cost per pound of strawberries at four different stores.
At which store are strawberries about
per pound? Look at the
-axis and find the place where a cost of is represented.
Which line shows a store wherepound of strawberries could be purchased for this price? What is the rate of cost of strawberries at store B?
How many dollars does one pound of strawberries cost?
per pound Which store has the most expensive strawberries? How can you tell?
Compare the cost of one pound of strawberries at each store.
Which store has the steepest line?