

Home > CC1MN > Chapter 9 > Lesson 9.2.3 > Problem 9-68
9-68.
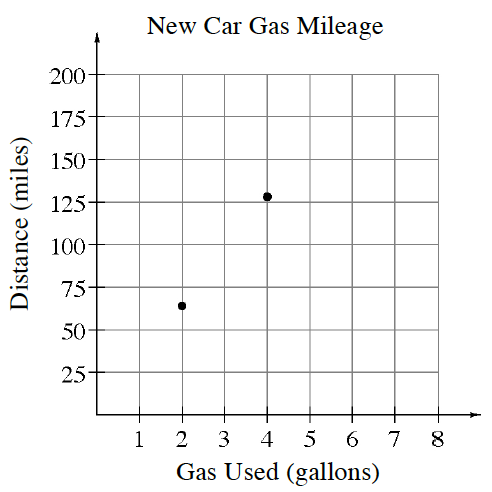
The graph below displays gas mileage for a new car.
Use the graph to predict the number of miles the car could travel with three gallons of gas.
A line drawn through the two points would cross
at about miles, so that is a reasonable estimate. Use the graph to predict the number of miles the car could travel with five gallons of gas.
Where does the line from part (a) cross
gallons?
Use the eTool to continue graphing points by adding point to the table.
Click on the link at right for the full eTool version: 9-68 HW eTool