Home > CC2MN > Chapter 10 > Lesson 10.1.1 > Problem 10-8
10-8.
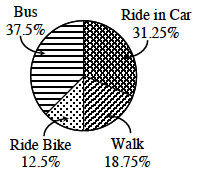
A group of classmates surveyed how other students travel to school. The results of the survey are shown in the table at right. Make a circle graph showing the results of the survey using percents.
Mode of Transportation | Number of Students |
|---|---|
Bus | |
Ride Bike | |
Ride in Car | |
Walk |
Find the students using each mode of transportation as a percentage of all the students.
Each category of data is then represented by a portion of the circle. The measure of the angle of each sector portion is directly proportional to the corresponding percentage.
Consider the bike riders.
Proportionately as an angle, this would be