

Home > CC3MN > Chapter 10 > Lesson 10.2.1 > Problem 10-50
10-50.
Make a table for the rule
that includes -values from to . What happened? What happens when you substitute a negative answer for
?
Does this make sense?The graph has no value for
. Graph the rule on graph paper.
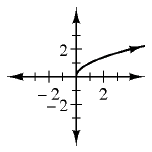
What kind of growth does the rule show? How do you know?
Do the y-values increase by a constant amount?
Is this relationship a function? How do you know?
Is there one output for every input?