Home > CC3MN > Chapter 10 > Lesson 10.2.3 > Problem 10-69
10-69.
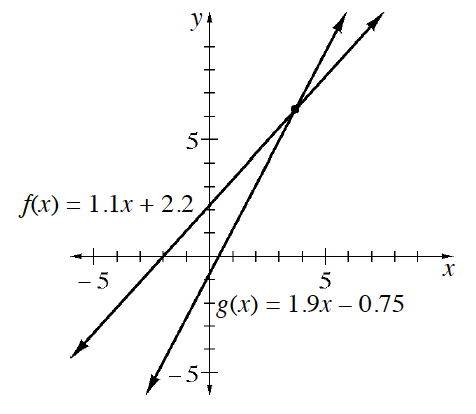
The graph below shows the lines

What is the point at which the two lines intersect?
A reasonably close estimate is

The graph below shows the lines

What is the point at which the two lines intersect?
A reasonably close estimate is