

Home > CC3MN > Chapter 2 > Lesson 2.1.5 > Problem 2-53
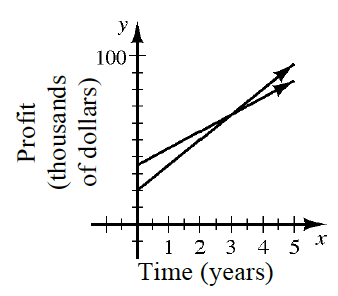
Sketch this graph on your paper. If Company A started out with more profit than Company B, determine which line represents A and which represents B. Label the lines appropriately.
Company A's line should have a greater
-intercept, since they started with more profit than Company B. See the graph below.
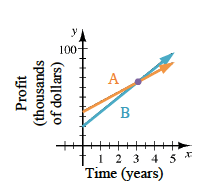
In how many years will both companies have the same profit?
Find where the two lines intersect.
Determine the
-coordinate for this point. years Approximately what will that profit be?
The profit is the
-coordinate of the intercept. Each tick mark represents . Which company’s profits are growing more quickly? How can you tell?
Growth is related to how steep a line is. Which line is steeper?