Home > CC3MN > Chapter 2 > Lesson 2.1.6 > Problem 2-59
Cairo wants to create a graph that represents the heights and bases of all rectangles that have an area of
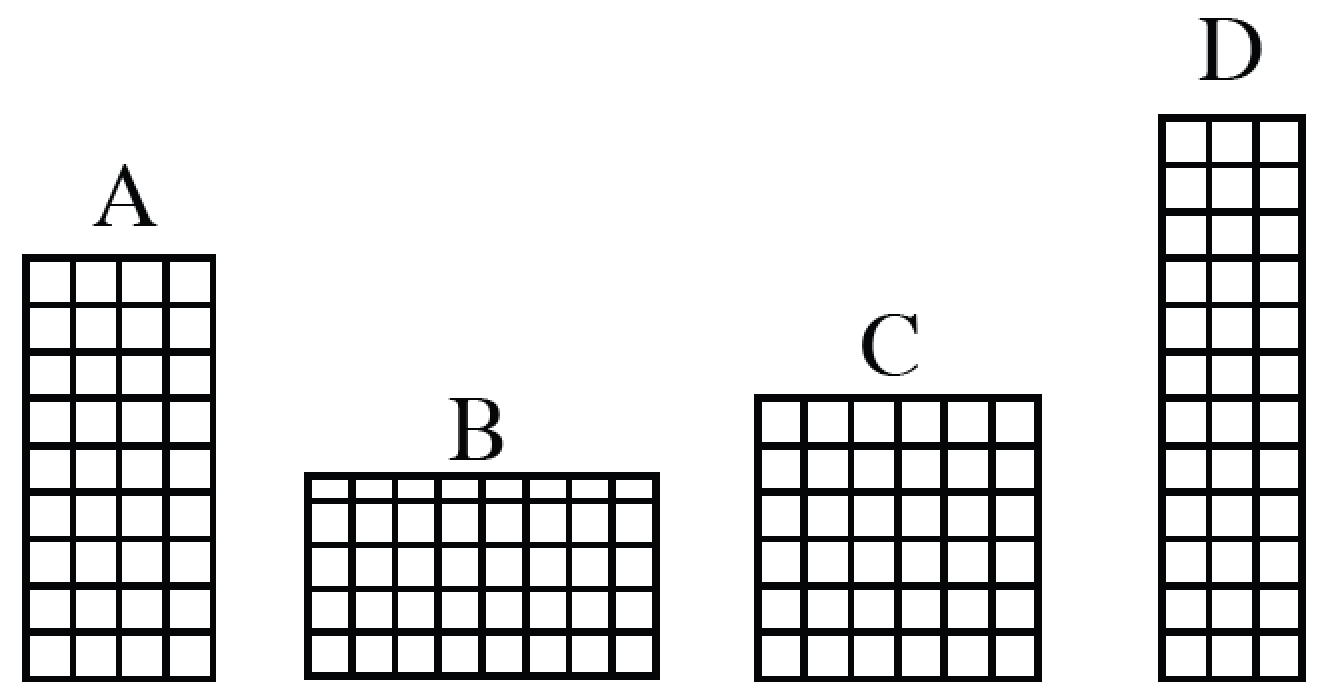
Rectangle A has a height of
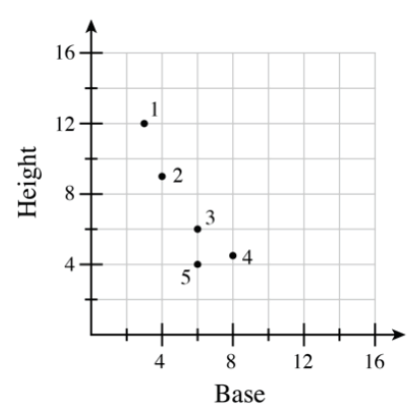
units and a base of units. Its corresponding point should be . It corresponds to number
. Repeat for each rectangle.
You should find that
is not matched.
What are the base, height, and area for the unmatched point?
Point
is over and up on the graph. Knowing this information, what are the rectangle's base, height, and area?
Remember that the area is the base multiplied by the height.Why should the unmatched point not be on Cairo's graph?
Check the area of the unmatched rectangle that is represented by point
. Does that area meet the qualifications of Cairo's graph that only contains rectangles with areas that are equal to ? Find the dimensions of three more rectangles that have areas of
square units. At least one of your examples should have dimensions that are not integers. Place a new point on the graph for each new rectangle you find. Answers will vary.
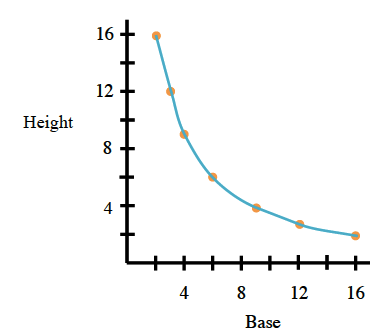
Connect all of the points representing an area of
square units. Describe the resulting graph. The graph should display a curve similar to the one at right.