

Home > CC3MN > Chapter 7 > Lesson 7.1.1 > Problem 7-6
Look at the scatterplots and use your experience to decide which statement fits each scatterplot. If there is a relationship, describe it in a sentence.

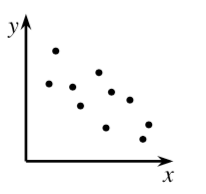
A city’s average daytime temperature in January and its latitude. Recall that the equator is at
latitude and the poles are at latitude. The North Pole has a much greater latitude than the equator but the temperature is much colder at the North Pole. So as latitude increases, average daytime temperature decreases. Which plot does this correspond to?
ii.
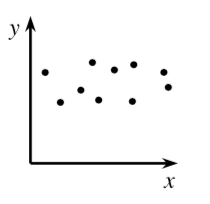
Weight of a car and its speed in a traffic jam on the freeway.
In a traffic jam, is anyone going significantly faster than anyone else?
iv.
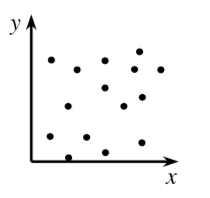
Number of pets a student has at home and their grades.
Assume that the time it takes to care for the pets is not significant enough to take away from studying time.
Cost of a person’s home and the value of their car.
Generally, people with more expensive houses drive more expensive cars.