CPM Homework Banner
7-17.

For each scatterplot below, determine if there is an association between the points. Label each graph as showing a positive association, negative association, or no association. If there is an association, write a sentence describing it.

  1. First quadrant scatter plot, x axis labeled, average number of hours watching TV per Day, and y-axis labeled, Grade point average. The points tend in the same downward direction. For lower x values, the y values are higher. For higher x values, the y values are lower.

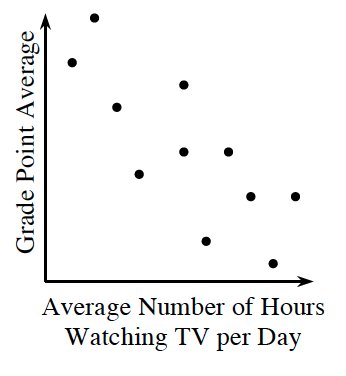
    As the number of hours watching TV increases, the grade point average decreases.
    The graph has a negative correlation.

  1. First quadrant scatter plot, x-axis labeled, age, y-axis labeled, Number of Gray Hairs on One's Head. For the first half of the x values, the y values rise to the first third of the y values. In the last half of the x values, the y values are scattered across the top 2 thirds of the y values.

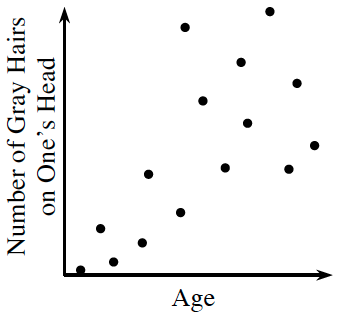
    Positive correlation.

  1. A first quadrant scatterplot, with 10 very scattered points, with no clear indication of the location of y values, based on the location of x values.

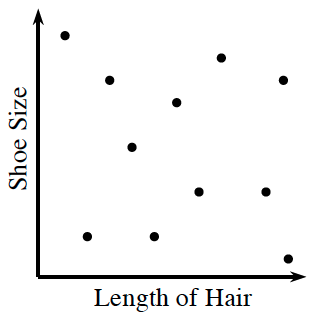
    Is there any trend in the graph above?