CPM Homework Banner
2-95.

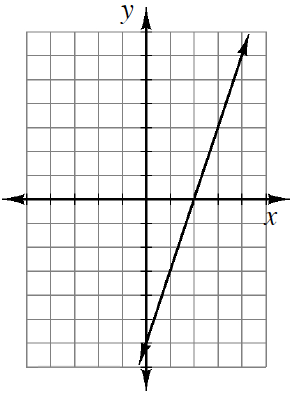
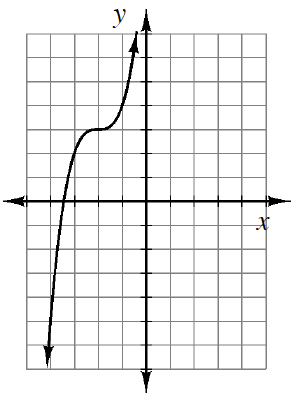
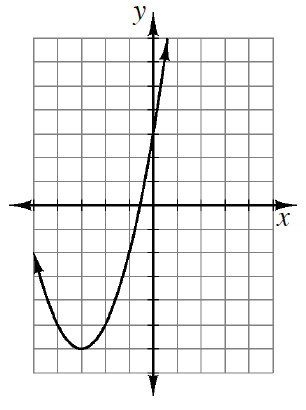
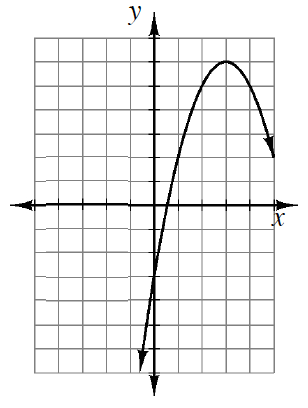
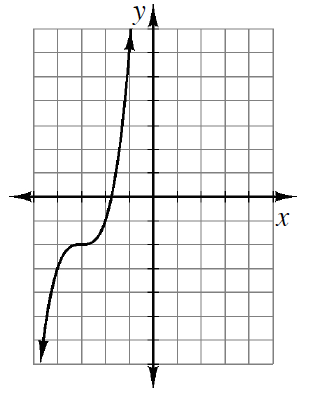
Escribe una posible ecuación para cada uno de estos gráficos. Supón que una marca en cada eje representa una unidad. Cuando estés en clase, verifica tus ecuaciones con una calculadora gráfica y compara tus resultados con los de tus compañeros de clase. .

  1. 2 sections of decreasing curves, with dashed vertical line at, x, = negative 2. Left section approaches, x axis from bottom, & vertical line from the left. Right section approaches, x axis from top, & vertical line from the right.

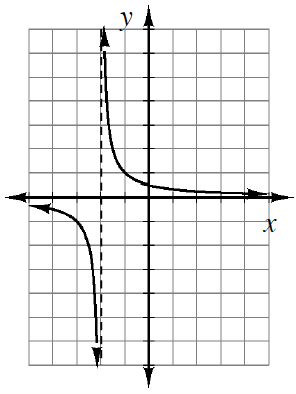
    Observa que esta es una hipérbola .

  1. Upward parabola, vertex at (0, comma negative 5), passing through the points (2, comma negative 1), & (negative 2, comma negative 1).

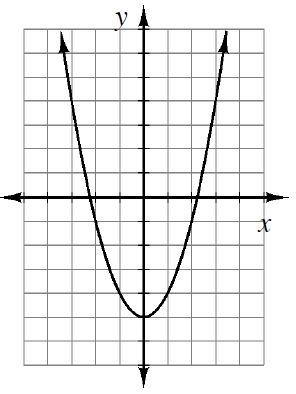
    Observa que el vértice es .

  1. Increasing curve, rises quickly, flattens out as it passes through the point (3, comma 0), and then rises quickly again.

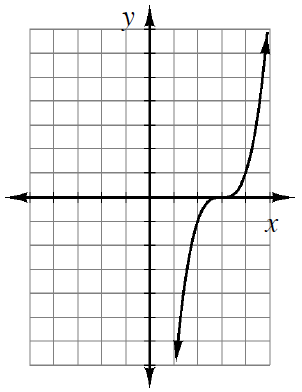
    Observa que este gráfico es cúbico.

  1. Increasing curve, with horizontal dashed line at, y, = negative 3. Left side of graph approaches the horizontal line from above, right side grows rapidly.

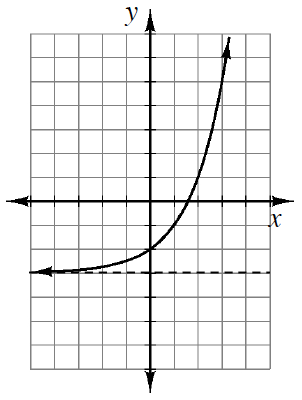
    Observa que este gráfico es exponencial.

  1. Increasing line, passing through the points, (0, comma negative 6), & (2, comma 0).

    Observa que el punto de corte con el eje es .

  1. Increasing curve, rises quickly, flattens out as it passes through the point (negative 2, comma 3), and then rises quickly again.

    Mira las pistas de las partes (a)-(e) para ayudarte a resolver las partes (f)-(i).

  1. Upward parabola, vertex at (negative 3, comma negative 6) & passing through (0, comma 3).

  1. Downward parabola, vertex at (3, comma 6), and passes through (0, comma negative 3).

  1. Increasing curve, rises quickly, flattens out as it passes through the point (negative 3, comma negative 2), and then rises quickly again.

Usa la siguiente eTool para graficar las ecuaciones.
Haz clic en el enlace de la derecha para ver la versión completa de la eTool: CCA2 2-95 HW eTool (ESP)