CPM Homework Banner
C-56.

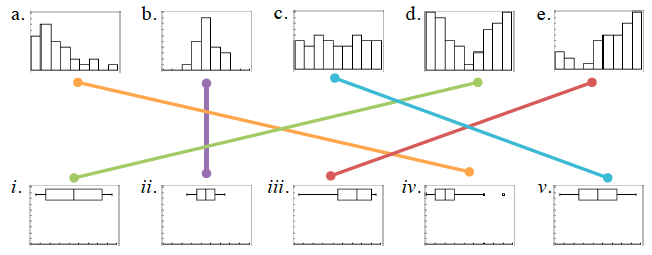
Une cada histograma con el diagrama de caja correspondiente.

Your teacher will provide you with a model of the graph.

Your teacher will provide you with a model of the graph.

Your teacher will provide you with a model of the graph.

Your teacher will provide you with a model of the graph.

Your teacher will provide you with a model of the graph.

Your teacher will provide you with a model of the graph.

Your teacher will provide you with a model of the graph.

Your teacher will provide you with a model of the graph.

Your teacher will provide you with a model of the graph.

Your teacher will provide you with a model of the graph.

Observa dónde están el valor máximo y el mínimo de cada uno y ten en cuenta que la concentración de los datos en un histograma se refleja en el diagrama de cajas.

Donde las columnas de un histograma son más altas, los segmentos del diagrama de cajas serán más cortos. Si los datos están sesgados a un lado, la mediana y los cuartiles se aproximarán más a ese lado.

Answers: a to Roman numeral 4, b to Roman numeral 2, c to Roman numeral 5, d to Roman numeral 1, and e to Roman numeral 3.