CPM Homework Banner
4-102.

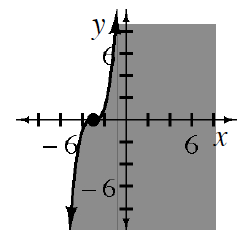
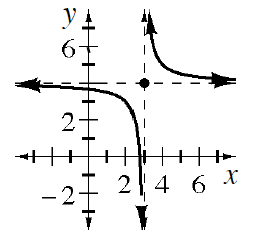
En otro par de ejes, diagrama el gráfico de las siguientes ecuaciones o desigualdades:

  1. Increasing solid cubic curve, centered at (negative 3, comma 0), divides plane into 2 regions, region to the right is shaded.

  1. Decreasing hyperbola, with asymptotes, x, = 3, &, y, = 4, showing as dashed. Left curve, opens down, below and left of asymptote intersection. Right curve, opens up, above & right of asymptote intersection.