CPM Homework Banner
10-105.

Une cada ecuación a continuación con su gráfico correspondiente. ¿Puedes hacerlo sin crear ninguna tabla?

  1. Increasing exponential graph, passing through the point (0, comma 4), fairly level, at y = 3, left of the y axis, & climbing rapidly, right of the y axis.

  1. Increasing exponential graph, passing through the point (0, comma 3), fairly level, at y = 2, left of the y axis, & climbing rapidly, right of the y axis.

  1. Increasing exponential graph, passing through the origin, fairly level, at y = negative 1, left of the y axis, & climbing rapidly, right of the y axis.

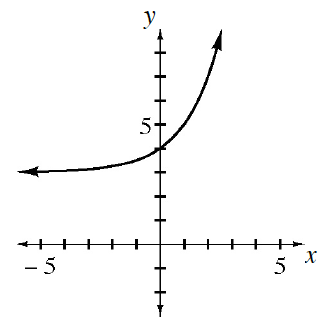
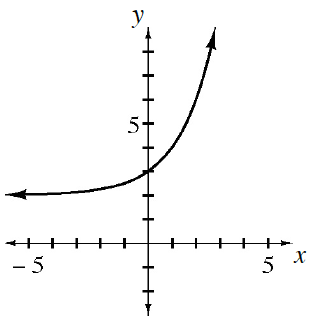
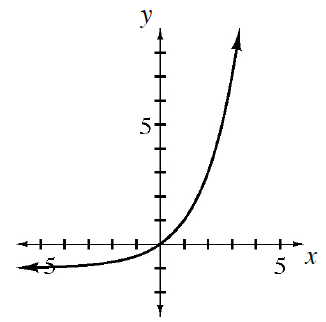
Considera el punto de corte con el eje y para cada función.

Considerando la ecuación (a). El punto de corte con el eje y se calcula para .
Entonces, de manera que cuando .
¿Cuál gráfico tiene en él?