CPM Homework Banner

Home > INT3S > Chapter 8 > Lesson 8.3.1 > Problem 8-102

8-102.

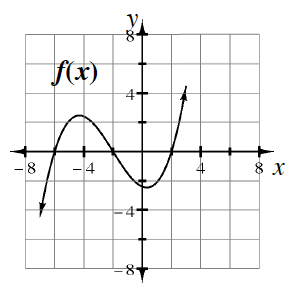
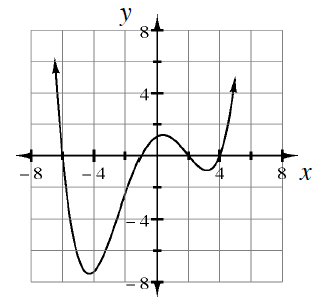
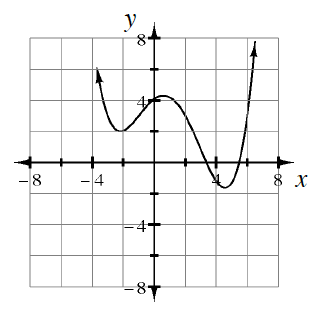
Cada uno de los siguientes gráficos representa una función polinómica. Indica el grado mínimo de cada función y el número de raíces reales y complejas que tiene.

Ejemplo: El gráfico de de la derecha es de grado .
Tiene tres raíces reales y ninguna raíz compleja.
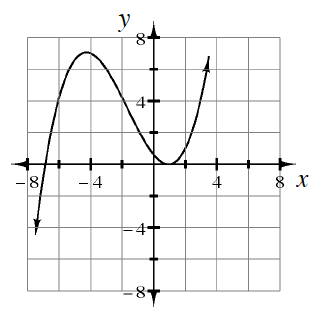
A curved continuous graph, with arrows at both ends, that rises from the bottom left, to the approximate point, (negative 4.5, comma 2), then falls to the approximate point, (1 half, comma negative 2), then rises again.

  1. A curved continuous graph, with arrows at both ends, that rises from the bottom left, to the approximate point, (negative 4.5, comma 7), then falls to the approximate point, (1 half, comma 0), then rises again.

    Grado
    Hay dos raíces reales distintas, de las cuales, una está repetida.
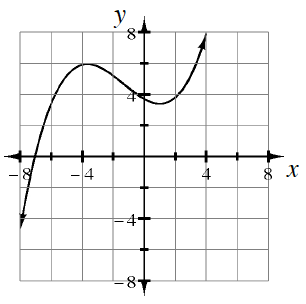
  1. A curved continuous graph, with arrows at both ends, that rises from the bottom left, to the point, (negative 4, comma 6), then falls to the approximate point, (1, comma 3), then rises again.

  1. Continuous, curved graph, decreasing from top left, turning at the following approximate points: low vertices: (negative 4, comma negative 7), & (3, comma negative 1), & high vertex, (0, comma 1.5), with x intercepts, at negative 6, negative 1, 2, & 4..

  1. Continuous, curved graph, decreasing from top left, turning at the following approximate points: low vertices: (negative 2, comma 2), & (5, comma negative 2), & high vertex, (1, comma 4), with x intercepts, at 3, & 5.5.

    Grado
    Hay dos raíces reales y dos raíces complejas.