Home > INT3 > Chapter Ch2 > Lesson 2.1.2 > Problem 2-22
2-22.
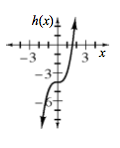
Make a table and a complete graph for
Use the table in the eTool below to find the domain, range, and intercepts.
Click the link at right for the full version of the eTool: 2-22 HW eTool
Make a table with values of
For the domain, what possible
For the range, what possible
One of the intercepts appears in the table and is exact. Which one?
You can see the other intercept on your graph, but it is approximate.
Use the equation to find a more precise answer by substituting