Home > INT3 > Chapter Ch4 > Lesson 4.4.3 > Problem 4-126
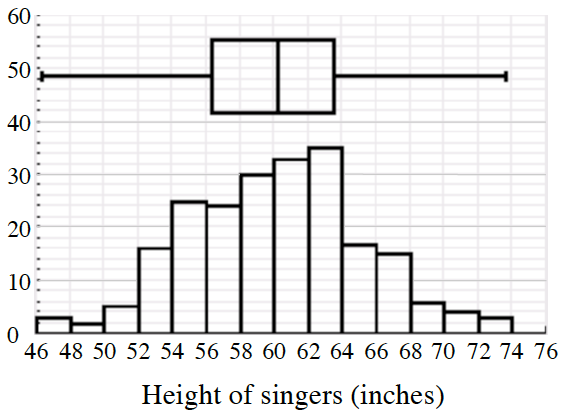
Mrs. Bell measures the heights of the
In approximately what percentile is a singer who is
tall? Each bar of the graph represents an amount of singers. Add up the heights of the bars on the graph for singers under
tall and divide by . Mrs. Bell models the heights of her singers using a normal distribution with a mean of
inches and a standard deviation of . She assumes her model applies to all girls at the state competition. How many singers at the competition can Mrs. Bell expect to be taller than ? Use your calculator. What are the lower and upper bounds of the heights you are interested in?
normalcdf(
, ^ , , )